See what the indicators say — then decide for yourself.
Tabby Trade runs transparent technical-analysis rules over public market data and explains the reasoning behind every score — so you can learn how these techniques work, and how they fail.
Illustrative examples — stylized representations with sample data, not live market data or screenshots.
A transparent look at the technicals
Dozens of indicators, summarized in plain English — with an honest note on what each reading means and where it tends to mislead. Built to help you learn, never to tell you what to do.
40+ indicator vote engine
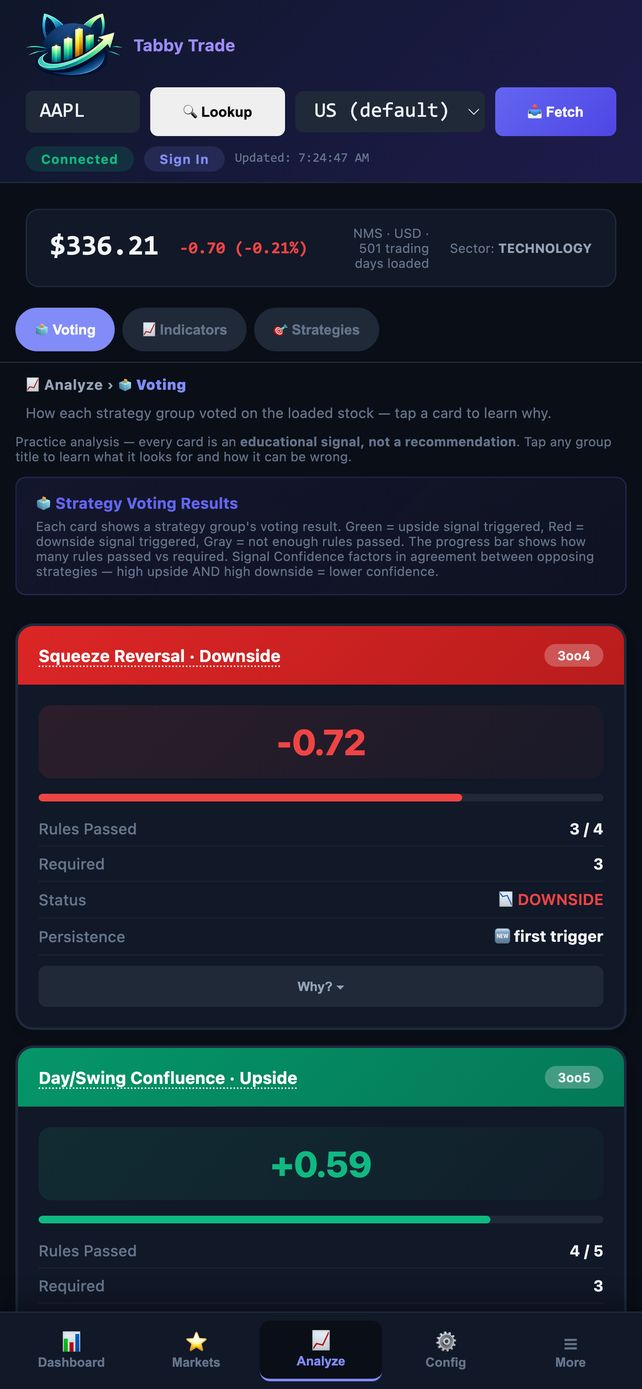
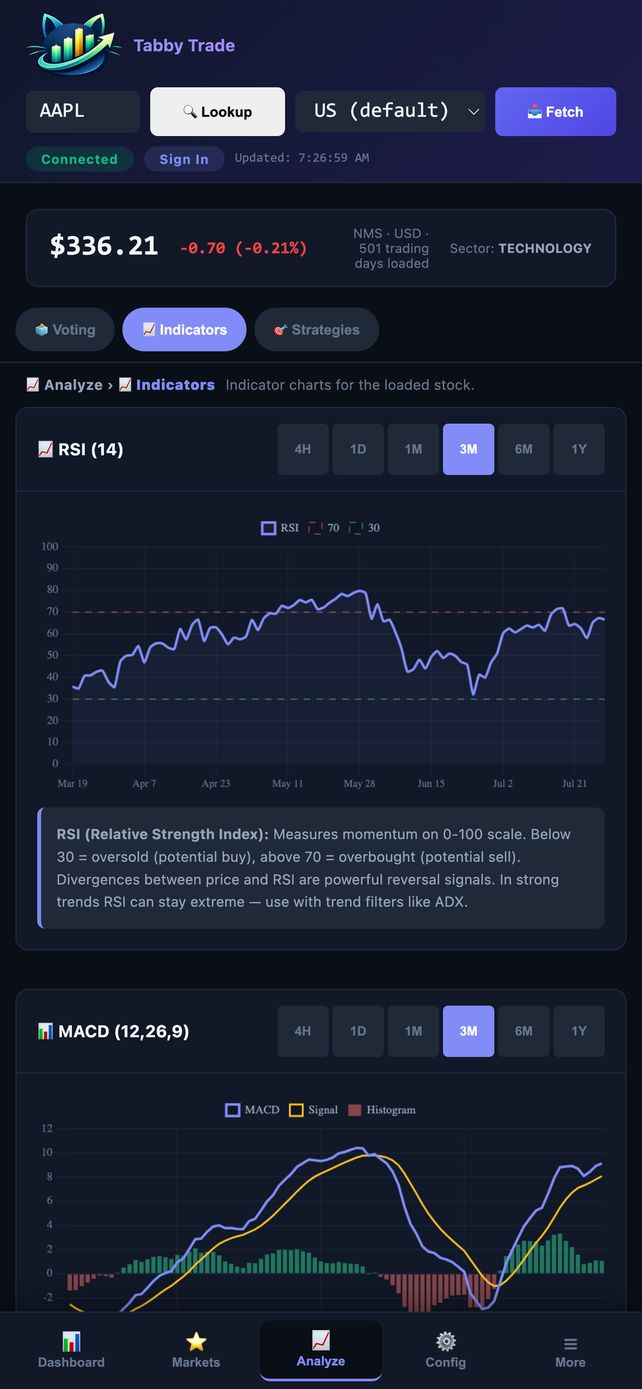
RSI, MACD, Bollinger Bands, TTM Squeeze, Supertrend, EMA ribbon, OBV, divergence and more each cast an upside or downside vote, so you can see where the weight of the evidence leans. Every group is tap-to-open with a plain-language explainer.
Composite score & agreement
One Composite Score and an agreement reading summarize how strongly the indicators concur — so you can gauge conviction versus conflict without scanning 22 charts yourself. Descriptive output of fixed formulas, framed as educational, never predictive.
Swing confluence view
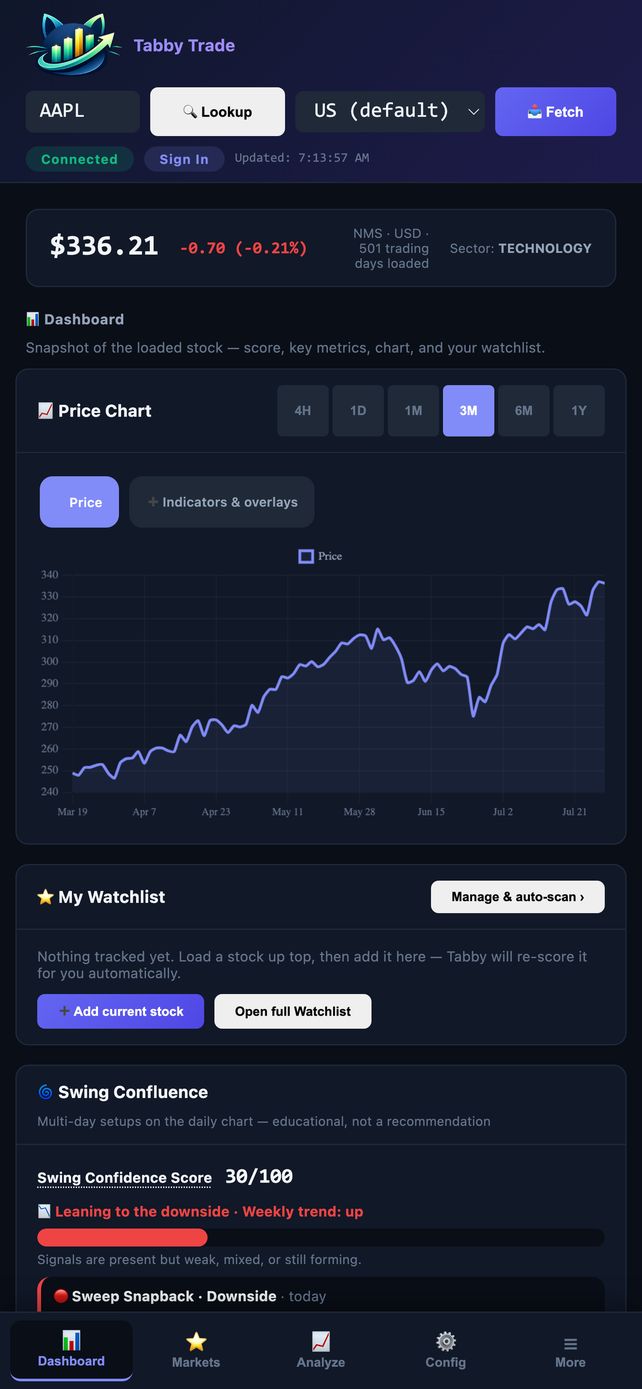
A swing engine highlights multi-day patterns — failed-break reversals, trend-line coils, volatility shifts and volume tells — and rolls them into a 0–100 confidence score with tags explaining why. By design, no single pattern can clear the bar alone.
Watchlist auto-scanner
Track a list of symbols and let Tabby re-run the full analysis on each at an interval you choose, surfacing price, score, agreement and trend/volatility flags in one table. Your list syncs across your devices.
Educational alerts
Get notified by push or email the moment a symbol's confluence crosses a threshold you set. A cloud scanner can watch your list even while the app is closed. Every alert is worded as an educational signal — never a recommendation to act.
Learn as you go
A searchable 100+ term glossary, indicator deep-dives and strategy playbooks turn jargon into everyday language, with tap-to-define terms throughout. Each explainer includes an honest "when it misleads" caveat and a worked example on the symbol you're viewing.
See it in action
Real screens from the current build, live AAPL data — swipe through.
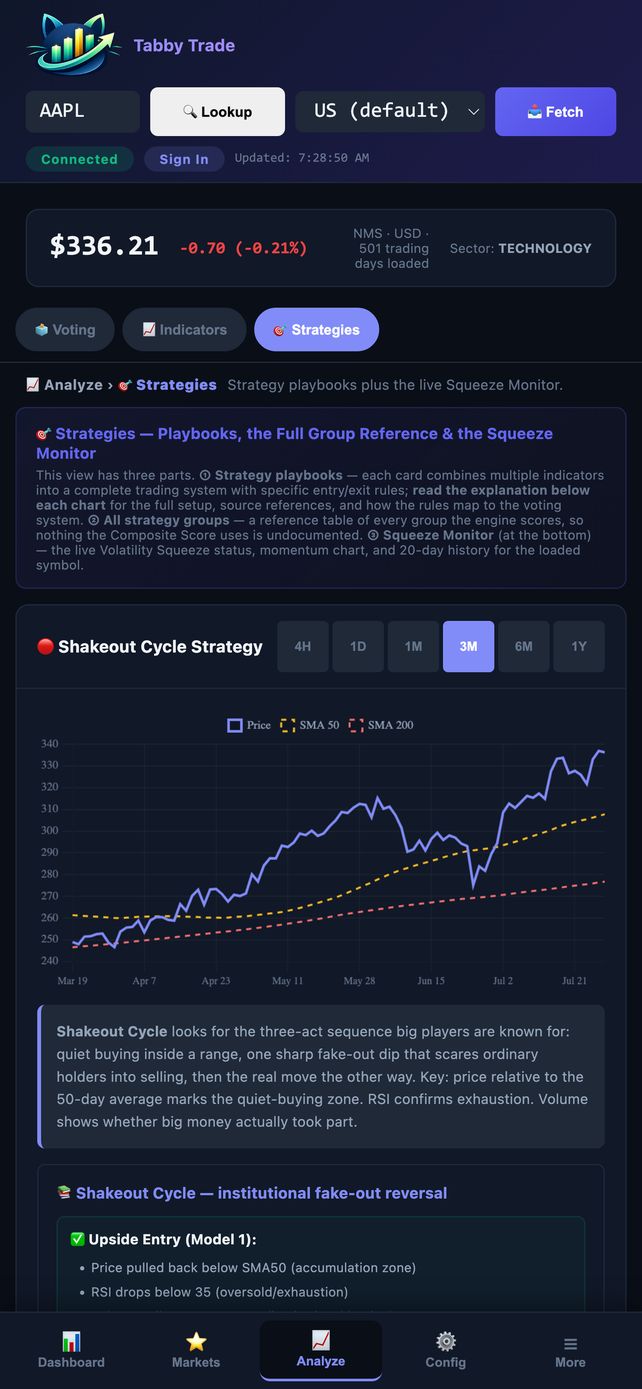
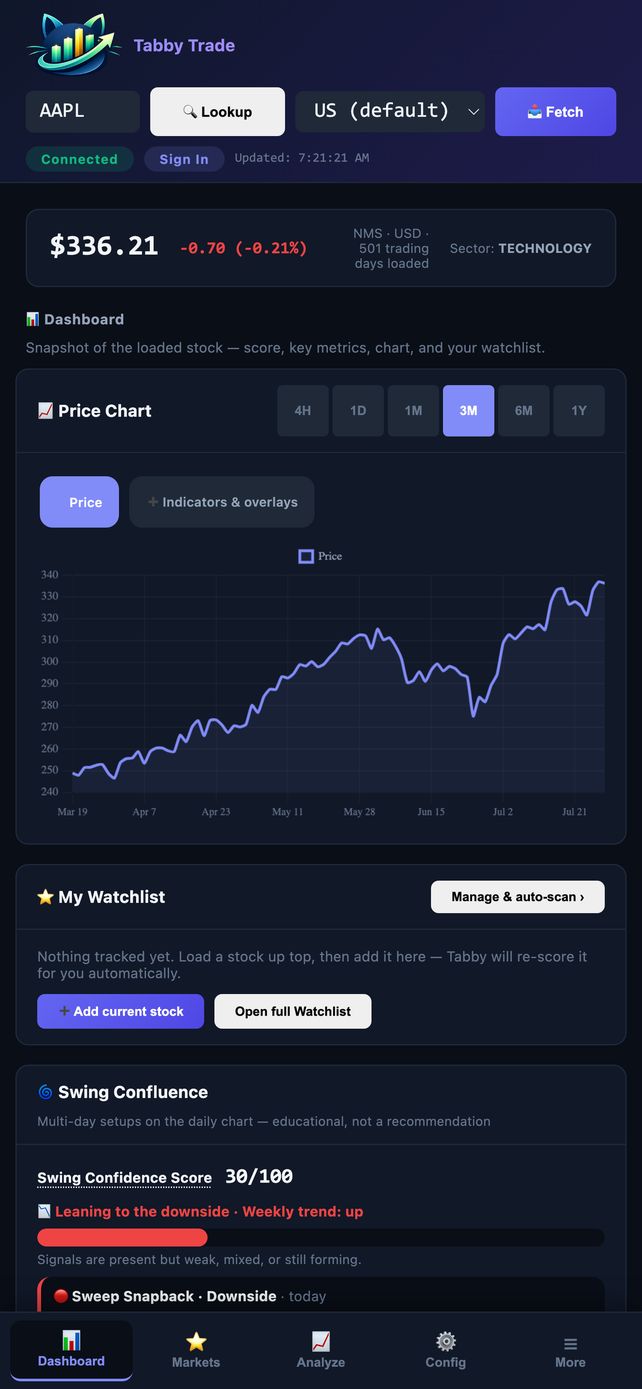
Every score comes with its reasoning
Tabby's Read boils the picture down to five gauges — Trend, Momentum, Volatility, relative volume and signal balance — and every title is tappable for a beginner-friendly definition. You always see why a reading landed where it did.
- ✓ Tap any indicator group to read what it measures — and when it fails
- ✓ Plain-language "Tabby's Read" gauges for the whole picture at a glance
- ✓ A conflict banner appears when trend and momentum disagree
- ✓ No win rates, no accuracy claims, no performance figures — anywhere
Set a threshold, get an educational heads-up
Choose the score and agreement levels you want to know about. When an evaluation crosses them, Tabby sends a notification worded as an educational signal — one alert per episode, re-armed when the reading settles back.
- ✓ Email or on-device push, plus optional background alerts while the app is closed
- ✓ Pick your own thresholds — strong-upside, strong-downside and minimum agreement
- ✓ Auto-scan a watchlist every 5, 15, 30 or 60 minutes
- ✓ Every message reminds you: educational signal, not a recommendation
Built to inform, not to advise
Tabby Trade is a study tool. It shows you what a fixed set of formulas reads in the data and teaches you how they work — it does not tell you what to buy or sell, and it never promises an outcome. Here's exactly what that means:
- ◆ It's for education and information only — nothing here is investment, financial, legal or tax advice.
- ◆ It's not a broker or adviser. It places no trades, manages no money, and holds no assets.
- ◆ Scores, signals and badges are descriptive output of fixed formulas — not predictions or personalized advice.
- ◆ We show no win rates, no accuracy scores and no performance figures — anywhere. The agreement reading simply counts how many indicators concur; it is not a measure of how often they're right.
- ◆ Market data comes from third parties and may be inaccurate, delayed or incomplete.
- ◆ Trading and investing carry substantial risk, including the possible loss of your entire investment.
- ◆ You are solely responsible for your own research and decisions, and you assume all risk.
- ◆ Consider consulting a licensed financial professional before acting on anything you learn here.
How Tabby Trade works
Look up any stock
Search a ticker across US, Canadian, UK, Australian and Hong Kong exchanges. Tabby pulls public quotes and price history and computes its full indicator suite.
Read the plain-language read-out
See how each group votes, plus the composite score, agreement, swing view and charts — with every term tappable for a beginner-friendly explanation.
Track it & get notified
Add symbols to your watchlist, set a threshold, and let Tabby surface changes and send educational alerts while you keep learning.
Start free. Upgrade if it helps.
Every analysis feature is in the free tier. Premium simply lifts the limits and adds background alerts.
- ✓ Full 40+ group analysis, composite score & agreement
- ✓ Swing confluence view & charts
- ✓ 1-symbol watchlist
- ✓ In-app & on-device alerts while the app is open
- ✓ The full education layer & glossary
- ✓ Unlimited watchlist & auto-scanner symbols
- ✓ Background push alerts, even when the app is closed
- ✓ Everything in Free
- ✓ Supports independent, ad-free development
Subscriptions are billed through the App Store (or Google Play) and shown in your local currency at checkout. Manage or cancel anytime in your store account.
Questions, answered
Is this financial advice? +
Does Tabby touch my money or my brokerage? +
What are "signals" and the composite score? +
Do you show win rates or accuracy? +
Where does the market data come from? +
Which platforms is it on? +
Who is it for? +
See what the indicators say.
Be first to know when Tabby Trade lands on the App Store — and get the transparent, educational read on any stock.